Looking Closer at Support for Political Violence August 30, 2024
Our recent surveys reveal an alarming trend: increased acceptance of political violence among Gen Z.
By: Lily Stockbridge, Melanie Phillips, and Grayson Wormser
While the assassination attempt on former President Trump is no longer the focus of the rapidly changing media headlines in the runup to the November 2024 election, threats of additional violence remain top of mind for many, especially activists and local election workers. Given the heightened role politically-motivated violence will play in our elections this year, Citizen Data wanted to dive deeper into our tracking data on voters’ attitudes toward violence.
Most Americans Across Political Divides Reject Political Violence
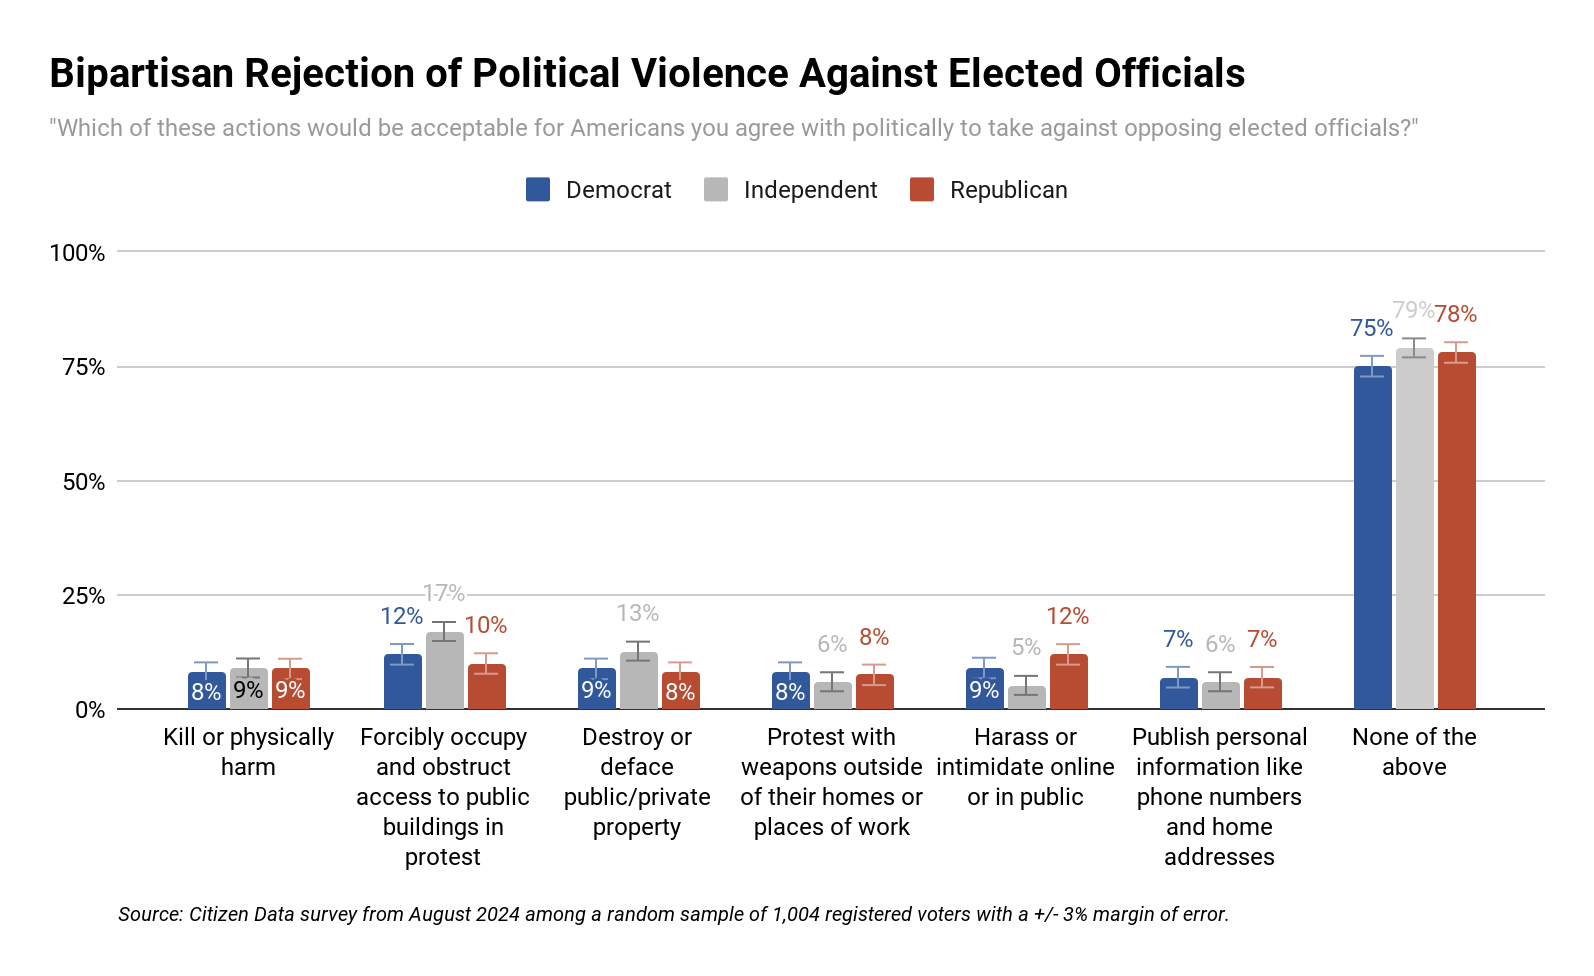
As of August 2024, over 3 in 4 of Americans reject any form of political violence against elected officials, including 78% of Republicans, 79% of Independents and 75% of Democrats. Interestingly, since the assassination attempt of former President Trump, we’ve observed an 11% and 10% proportional increase among Republicans and Independents, respectively, who say they reject violence against elected officials compared to data collected in May 2024.
However, Americans are 12% more likely to say they tolerate violence against “elected officials” compared to “other Americans with opposing political views” This result is likely due to several factors, including individuals’ deep distrust and dissatisfaction with politicians and political institutions.
Key Differences Emerge When Looking Closer At Specific Scenarios
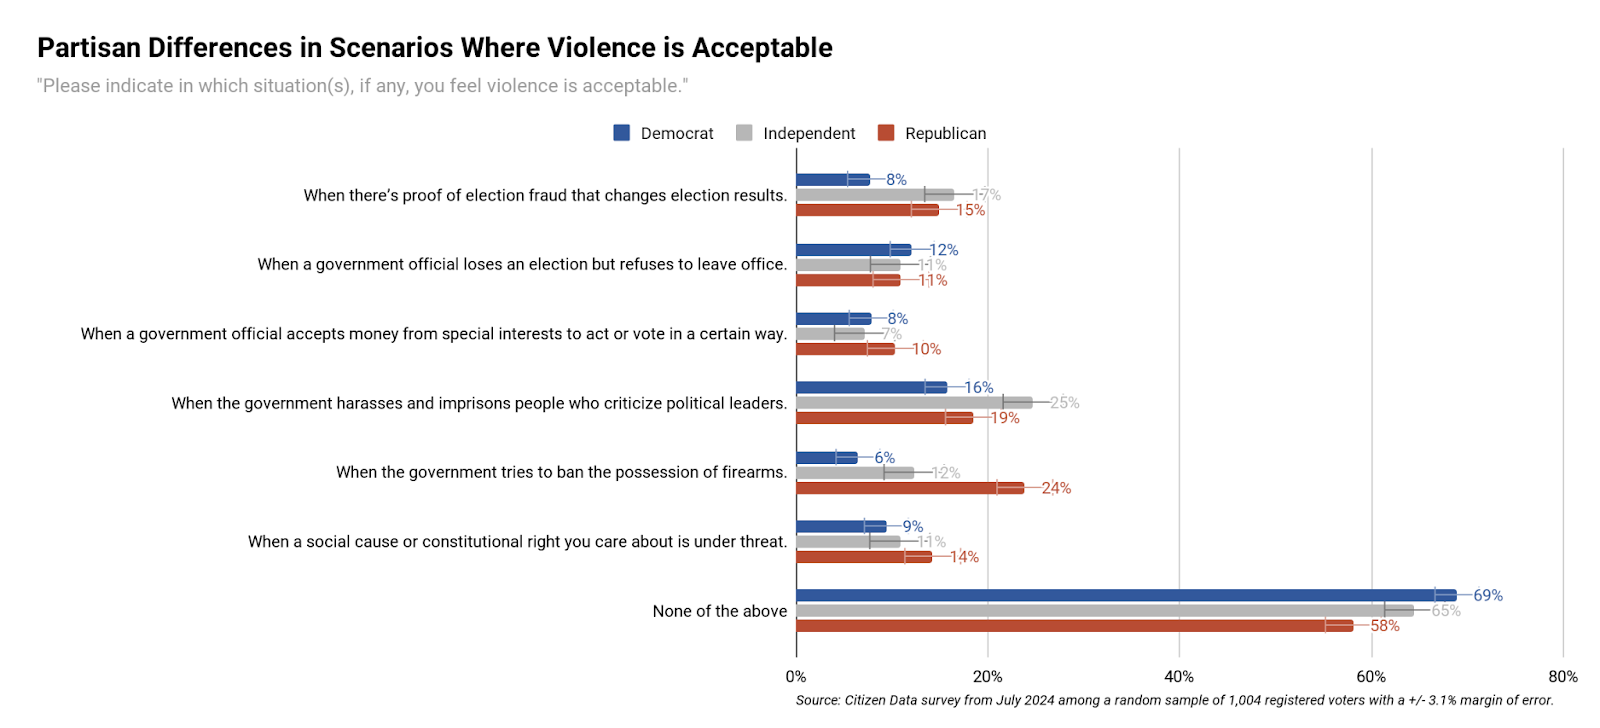
While a vast majority of Americans reject violence across party lines, there are notable differences between political parties when drilling down to specific scenarios. According to a Citizen Data survey fielded in July shortly after the assassination attempt, Republicans were four times more likely than Democrats to agree violence is acceptable if the government tries to ban firearms. Republicans and Independents were also twice as likely to accept violence in the case of election fraud. However, further research needs to be conducted to understand if these trends hold.
Concerning Trends Among Younger Generations
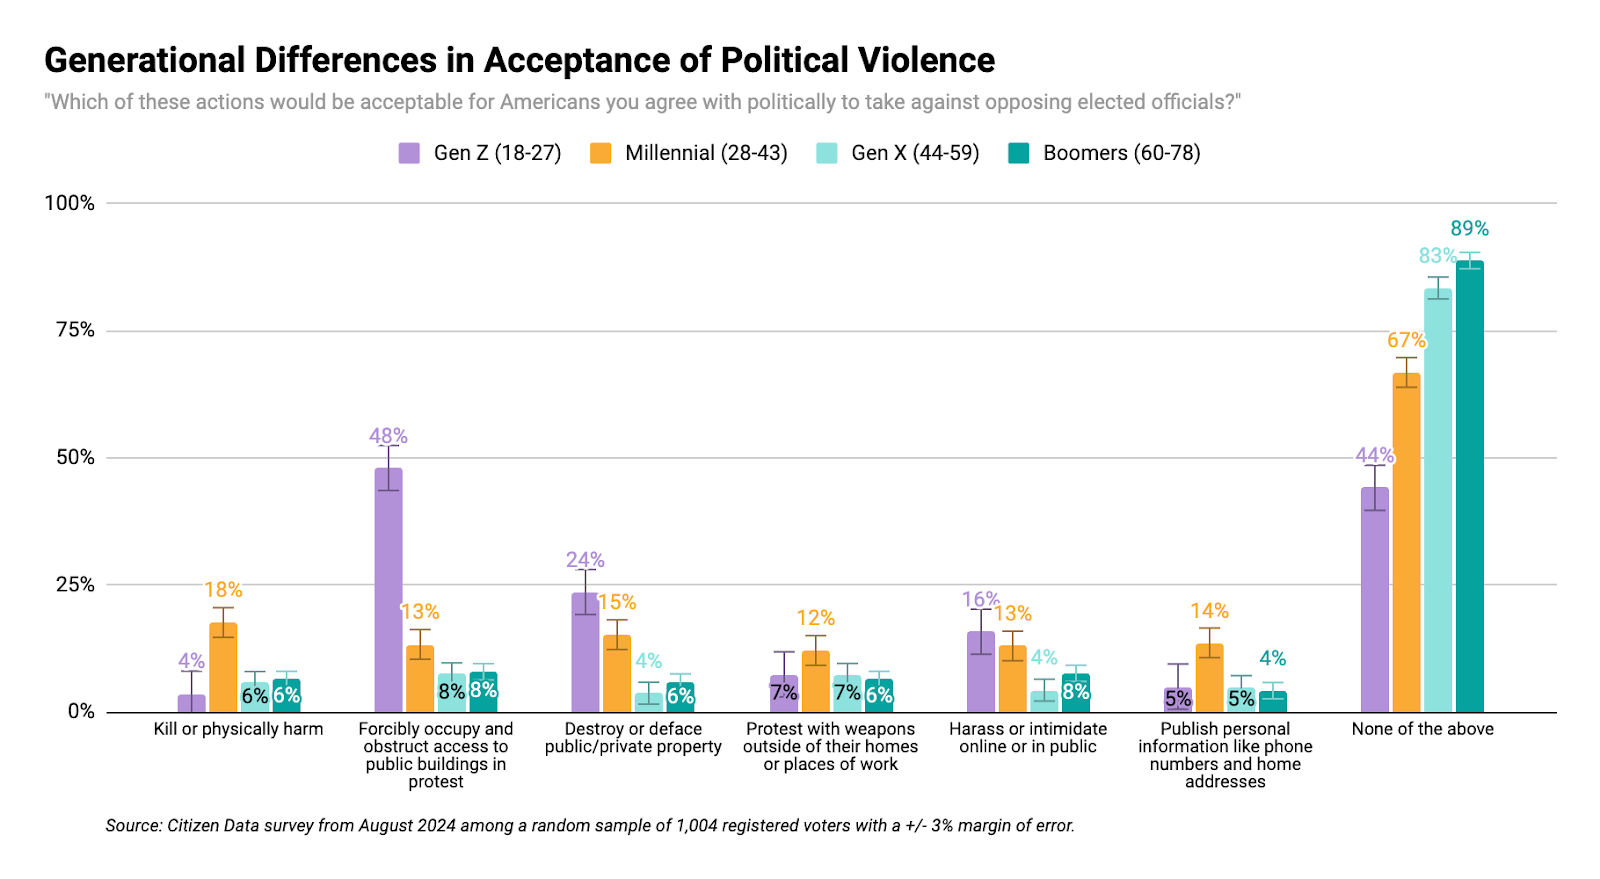
Over the past year, we’ve continued to observe concerning trends amongst younger Americans, especially Gen Z, when it comes to their acceptance of various forms of political violence. In August, only 44% of Gen Z and 67% of Millennials indicated that violence against elected officials is never acceptable, compared to nearly 90% of Boomers and Gen X. Perhaps even more alarming: nearly 2 in 10 Millennials found it acceptable to “kill or physically harm” elected officials and almost half of Gen Z found it acceptable to “forcibly occupy public buildings.”
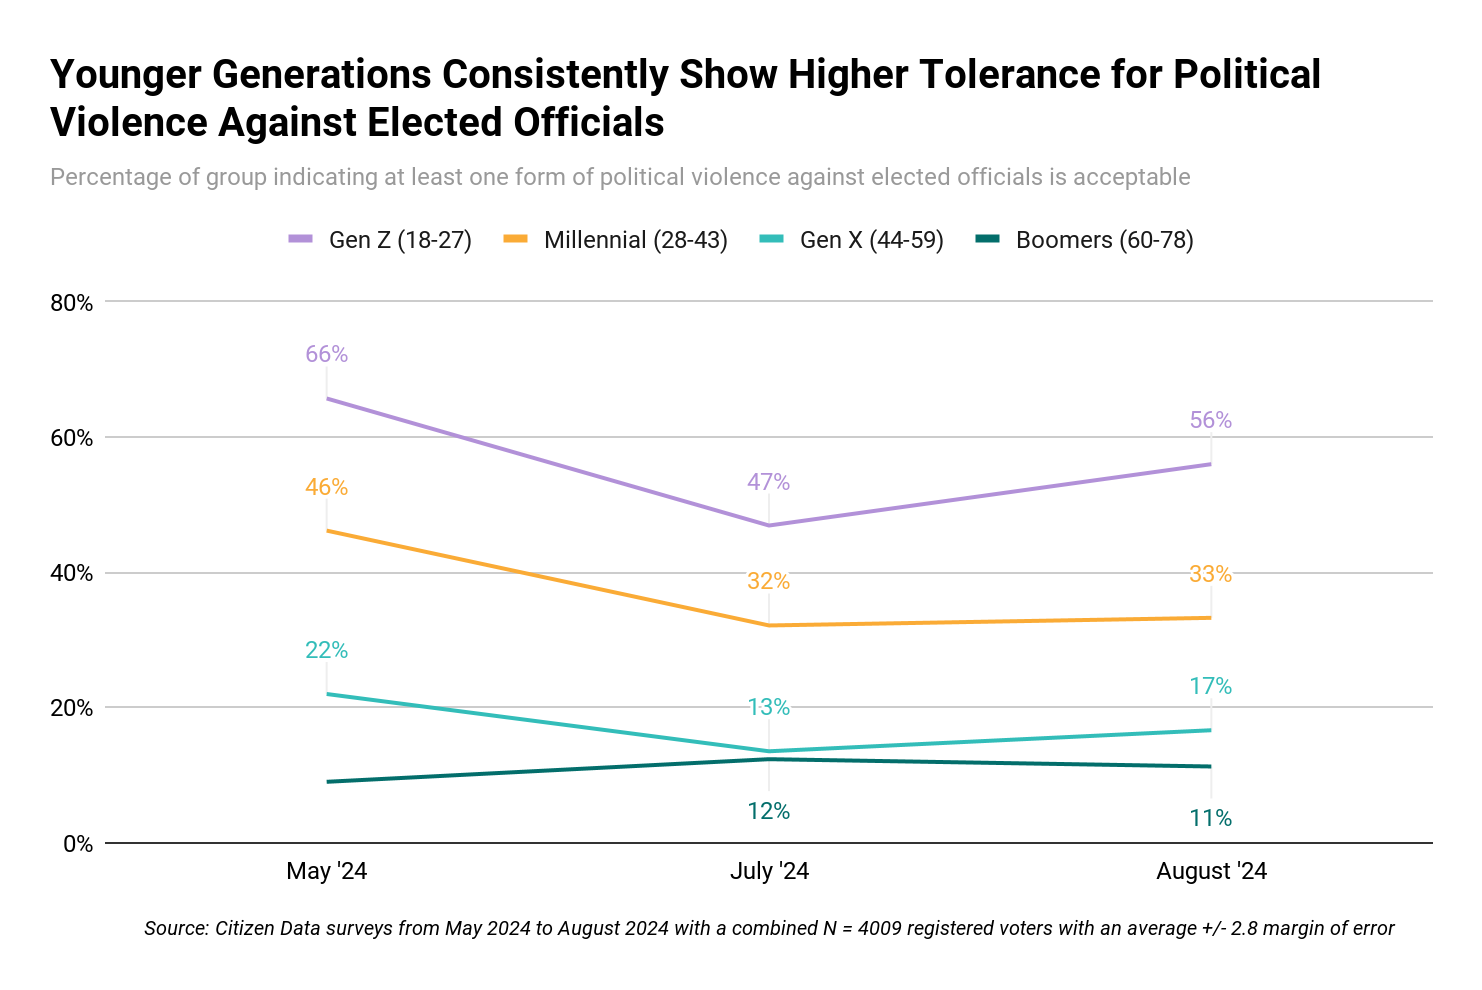
Furthermore, younger generations continually express higher levels of violence acceptability over time. Since May 2024, Gen Z stands out in their consistent higher tolerance of political violence suggesting a potential difference in their relationship with a core democratic principle. This finding aligns with other democracy measures we’ve tracked, including results from our May 2024 survey that found only 62% of Gen Z voters feel as if living in a democracy is important, compared to almost nine in ten Millennials, Gen X, and Baby Boomers.
This generational gap underscores the need for renewed efforts to engage younger voters in democratic processes given that younger generations, especially Gen Z, may not place the same importance on democracy as other generations.
Where the Threat Lies
Using predictive modeling, we developed an interactive map to better understand where there is an increased risk of violence if voters don’t trust election results. As seen below, Texas, Missouri, and Illinois stand out as high-risk states, including parts of Georgia, Tennessee, and Florida. Interestingly, Hawaii scored the lowest, with voters in the state presenting the lowest risk of violence across the country. On the other end of the spectrum, Texas scored the highest. Hover over the map to explore where voters in other counties of interest lie in their acceptance of political violence.
THE KEY TAKEAWAY
While we continue to see concerning trends among younger generations, it is encouraging that Americans are increasingly less accepting of political violence as we head into the November election. As we continue to track this data, we will be able to monitor if these recent overall declines in political violence acceptability persist, especially as news coverage of the assassination attempt dies down.
Interested in more on this topic or others? We’ll be continuing to track these key indicators to provide consistent, real-time feedback on the health of American democracy. Sign up for our latest insights here.
Methodology: Data comes from three separate surveys. In August, we sampled N = 1,004 registered voters with a +/- 3% margin of error and results were weighted on Party ID, race, age, and gender to ensure a nationally representative sample. In July, we sampled N = 1,004 registered voters with a margin of error +/- 3.1%, and results were weighted by Party ID, race, age, and education to ensure a nationally representative sample. In May, we sampled N=2,001 registered voters with a +/- 2.2% margin of error and results were weighted on Party ID, race, age, and education to ensure a nationally representative sample.
Share this report
Data for Democracy: Gen Z Sets Off Alarm Bells – September 2024
September 2024: diving deep into who supports political violence and where threats lie, how climate affects Americans’ financial decisions, satisfaction with democracy, & more.
