Data for Democracy: How Often are Voters Seeing Misinformation? – November 2024 November 4, 2024
November 2024 (pre-election): looking closer at how often Americans encounter misinformation, the links between financial security and civic engagement, and voters’ willingness to vote for female candidates.

Data for Democracy is our newsletter where we explore the latest data and insights from our monthly omnibus surveys. Sign up here to get this newsletter in your inbox every month.
Written by Grayson Wormser
Here are five insights you won’t want to miss this month:
1. How Often are Americans Encountering Misinformation?

What You Need to Know: Nearly 3 in 4 voters (71%) report encountering misinformation at least a few times in the last month, with 41% seeing it at least once a week. Only a small minority (6%) report never coming across false or misleading information. Interestingly, men are 10% more likely than women to say they’ve encountered false of misleading information a few times in the last month. This alarming data not only highlight the persistent challenge for information integrity but also emphasizes the increasing need for for digital literacy programs to help the public better identify reliable information sources that can ultimately help alleviate confusion, increase trust in media sources, and decrease political polarization.
Read More about Misinformation in 2024
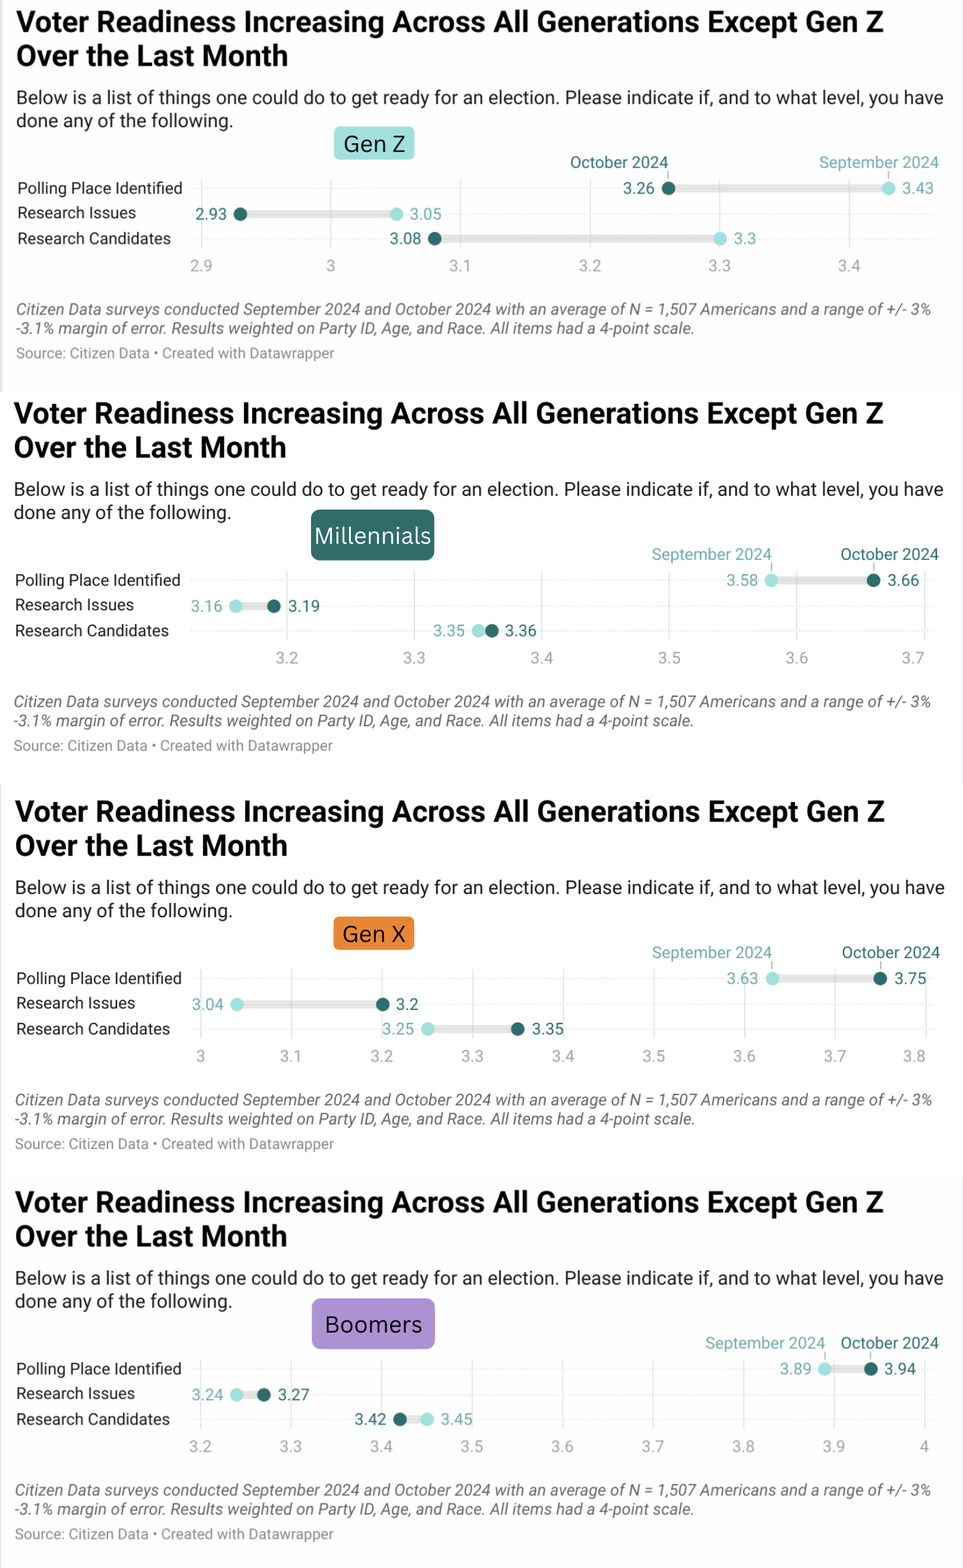
2. Are Americans Ready to Head to the Polls?

What You Need to Know: With only a few days left to vote, we wanted to get an updated picture of how prepared Americans are to vote. The bottom line: while all other generations scored higher on our voter readiness index from September to October 2024, Gen Z did the opposite. Concerningly, Gen Z experienced an 8% decrease in vote readiness across all of our measures (identifying their polling place, having researched the issues on the ballot, and having researched the candidates for election). Perhaps not surprisingly, Boomers (60-78 years old) scored the highest on all items. As our partners work to educate and turn out voters, it will be critically important to continue efforts to reach Gen Z voters during this final stretch.
3. How Financial Security Impacts Civic Engagement

What You Need to Know: While much focus has been placed on the groups of voters campaigns need to mobilize to win, less attention has been given to how a voter’s financial situation might impact their ability to participate in civic activities. We decided to look further into this with our friends over at the Urban Institute and found that there is a strong link between financial well-being and civic engagement. Using the CFPB’s Financial Well-Being Scale as a guide, we see that financially secure individuals are slightly more likely to vote in 2024, volunteer for a candidate or campaign, 3x to make a political donation and 2X as likely to display political signage. The bottom line: investing in financial well-being could reinforce democratic institutions and promote social unity.
4. Looking Closer at Financial Security and Political Party

What You Need to Know: Another key finding from our research with the Urban Institute revealed that financially secure voters are more likely to be satisfied with democracy and willing to play a part in reducing social division whether or not they identify as Democrats or Republicans. On the flip side, however, financially insecure Republicans are are 2x more likely than Democrats to be unsatisfied with the way democracy works for them, suggesting that financial security is a significant contributing factor to whether Republicans are satisfied with democracy or not. Check out a recording of the webinar where Citizen CEO Mindy Finn presents our findings:
5. An Uphill Battle for Female Candidates in 2024

What You Need to Know: This fall, we sought to better understand Americans’ willingness to vote for female candidates at the federal and state level, and the barriers that female candidates face running for office. We found that while over 85% of voters say they’re willing to vote for a female candidate at the federal level, they report only 61% of their neighbors would be willing to do the same. This perception gap — the difference between how willing an individual is to vote for a female candidate versus how willing they think their neighbor is to do the same — likely provides a more accurate reflection of the true sentiment, signaling a challenging road ahead for future female candidates.
Data-In-Action
Interested in getting your questions answered in our monthly omnibus survey? Learn more here and reach out to Grayson Wormser ([email protected]).
Sign up here to receive our latest insights and please reach out if you’d like to learn more about how we can work together to drive impact for your organization.
Share this report
THE STATE OF DEMOCRACY POST 2024 ELECTIONS
Following the 2024 elections, we explored voter attitudes and perceptions post-election while evaluating the overall state of democracy. Here is what we found.
