How to Understand and Use Crosstabs April 11, 2023
The what, why, when, and how for cross tabulations.
What are crosstabs?
Cross tabulations (crosstabs) analyze the relationship between categorical variables; in other words, they present the crossed counts of two or more variables.
A variable is any characteristic, number, or quantity that can be measured or counted. It may be ordinal (e.g., a voter’s age bracket) or categorical (e.g., a voter’s party registration).
Why are they important?
Raw data can be hard to interpret. Even for small data sets, it is easy to draw inaccurate conclusions by only examining the topline results.
Looking at the crosstabs can assist in identifying nuances and patterns within the data set.
Consider, for example, voter turnout in the 2020 Presidential Election. Roughly 48% of Americans cast a ballot in the race.
If one were to look at the crosstabs of all Americans by age, one would see that 0% of Americans under age 18 cast a ballot.
Cross tabulation offers a simple method of grouping variables, which minimizes the potential for confusion or error by providing clear results.
When and how to use crosstabs:
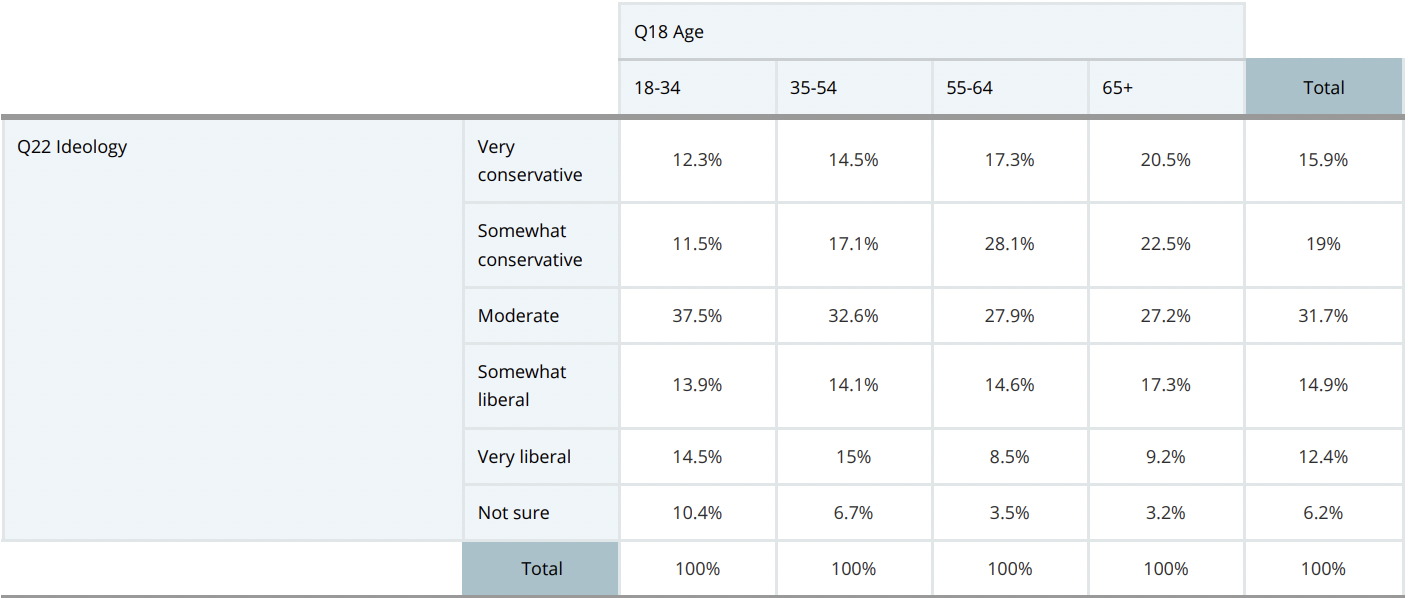
Here’s an example from our research analyzing the relationship between two variables: ideology and age.
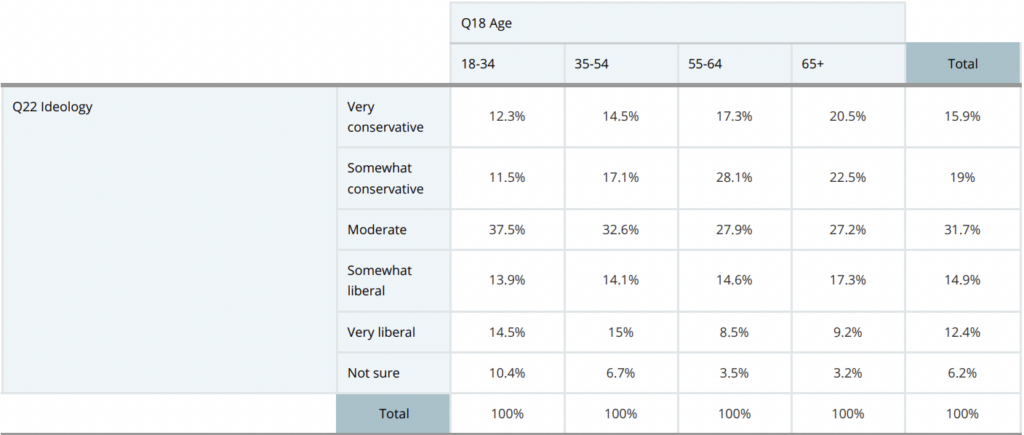
Here’s how to read the above crosstab:
Examine the item on the X-axis (columns) by the item on the Y (rows). So, 12.3% of Americans 18-34 identified in the survey as “very conservative,” while 14.5% said they were “very liberal.”
The same goes for the total column as well. Our survey results find that 15.9% of Americans are “very conservative” and 12.4% “very liberal.”
By examining these crosstabs, for example, one can recognize that the older someone is, the more likely they are to be “very conservative” in ideology.
It’s vital to examine survey data this way to ensure a comprehensive understanding of the results.
Here at Citizen, we’re experts in polling and data analysis. If you have any questions or want your own custom research to analyze, be sure to reach out.